empty
сформирован 31.03 в 22:05:12 (UTC+0)
сила сигнала 1 из 5
Двойная вершина GBPCHF M5

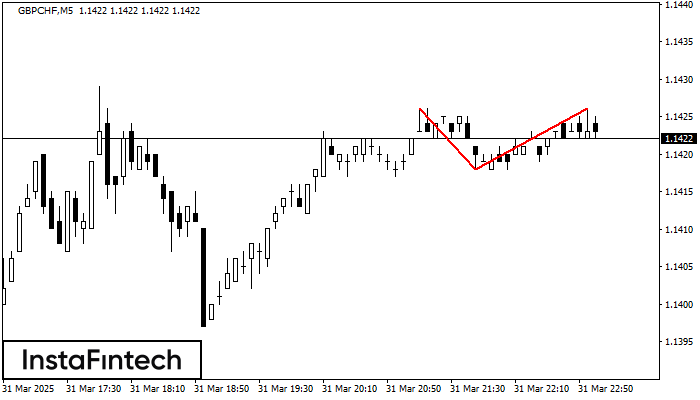
По торговому инструменту GBPCHF на M5 сформировалась фигура «Двойная вершина», которая сигнализирует нам об изменении тенденции с восходящей на нисходящую. Вероятно, что, в случае пробоя основания фигуры 1.1418, возможно дальнейшее нисходящее движение.

Таймфреймы М5 и М15 могут иметь больше ложных точек входа.

Фигура
  • Все
  • Вымпел
  • Голова и плечи
  • Двойная вершина
  • Прямоугольник
  • Треугольник
  • Тройная вершина
  • Флаг
Инструмент
  • Все
  • #AAPL
  • #AMZN
  • #Bitcoin
  • #EBAY
  • #FB
  • #GOOG
  • #INTC
  • #KO
  • #MA
  • #MCD
  • #MSFT
  • #NTDOY
  • #PEP
  • #TSLA
  • #TWTR
  • AUDCAD
  • AUDCHF
  • AUDJPY
  • AUDUSD
  • EURCAD
  • EURCHF
  • EURGBP
  • EURJPY
  • EURNZD
  • EURRUB
  • EURUSD
  • GBPAUD
  • GBPCHF
  • GBPJPY
  • GBPUSD
  • GOLD
  • NZDCAD
  • NZDCHF
  • NZDJPY
  • NZDUSD
  • SILVER
  • USDCAD
  • USDCHF
  • USDJPY
  • USDRUB
Таймфрейм
  • Все
  • M5
  • M15
  • M30
  • H1
  • D1
Тренд
  • Все
  • Покупка
  • Продажа
Сила сигнала
  • Все
  • 1
  • 2
  • 3
  • 4
  • 5
Bullish Rectangle
was formed on 14.04 at 13:01:10 (UTC+0)
signal strength 1 of 5
Bullish Rectangle AUDCHF M5

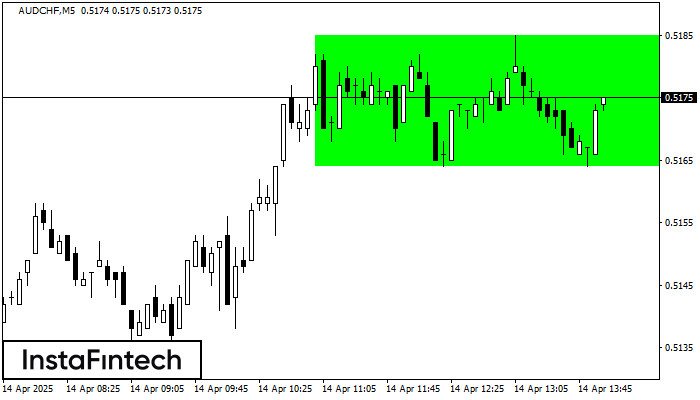
According to the chart of M5, AUDCHF formed the Bullish Rectangle. The pattern indicates a trend continuation. The upper border is 0.5185, the lower border is 0.5164. The signal means

The M5 and M15 time frames may have more false entry points.

Open chart in a new window
Double Bottom
was formed on 14.04 at 13:00:23 (UTC+0)
signal strength 4 of 5
Double Bottom USDJPY H1

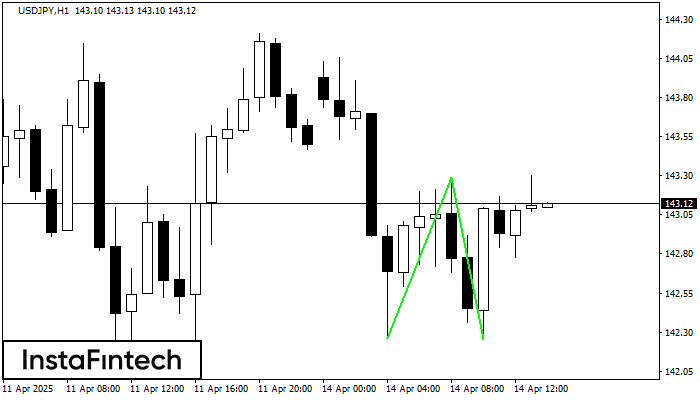
The Double Bottom pattern has been formed on USDJPY H1. Characteristics: the support level 142.26; the resistance level 143.29; the width of the pattern 103 points. If the resistance level

Open chart in a new window
Bullish Symmetrical Triangle
was formed on 14.04 at 12:56:06 (UTC+0)
signal strength 1 of 5
Bullish Symmetrical Triangle NZDJPY M5

According to the chart of M5, NZDJPY formed the Bullish Symmetrical Triangle pattern. Description: This is the pattern of a trend continuation. 84.17 and 83.88 are the coordinates

The M5 and M15 time frames may have more false entry points.

Open chart in a new window
Зараз не можете говорити по телефону?
Задайте Ваше питання у чаті.
Зворотній дзвінок
 

Dear visitor,

Your IP address shows that you are currently located in the USA. If you are a resident of the United States, you are prohibited from using the services of InstaFintech Group including online trading, online transfers, deposit/withdrawal of funds, etc.

If you think you are seeing this message by mistake and your location is not the US, kindly proceed to the website. Otherwise, you must leave the website in order to comply with government restrictions.

Why does your IP address show your location as the USA?

  • - you are using a VPN provided by a hosting company based in the United States;
  • - your IP does not have proper WHOIS records;
  • - an error occurred in the WHOIS geolocation database.

Please confirm whether you are a US resident or not by clicking the relevant button below. If you choose the wrong option, being a US resident, you will not be able to open an account with InstaForex anyway.

We are sorry for any inconvenience caused by this message.