empty
was formed on 07.04 at 05:00:16 (UTC+0)
signal strength 1 of 5
Double Top NZDJPY M5

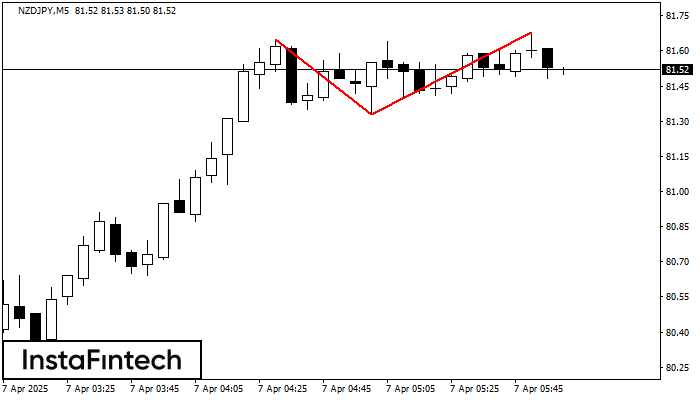
The Double Top pattern has been formed on NZDJPY M5. It signals that the trend has been changed from upwards to downwards. Probably, if the base of the pattern 81.33 is broken, the downward movement will continue.

The M5 and M15 time frames may have more false entry points.

Veja também

Figure
  • All
  • Double Top
  • Flag
  • Head and Shoulders
  • Pennant
  • Rectangle
  • Triangle
  • Triple top
Instrument
  • All
  • #AAPL
  • #AMZN
  • #Bitcoin
  • #EBAY
  • #FB
  • #GOOG
  • #INTC
  • #KO
  • #MA
  • #MCD
  • #MSFT
  • #NTDOY
  • #PEP
  • #TSLA
  • #TWTR
  • AUDCAD
  • AUDCHF
  • AUDJPY
  • AUDUSD
  • EURCAD
  • EURCHF
  • EURGBP
  • EURJPY
  • EURNZD
  • EURRUB
  • EURUSD
  • GBPAUD
  • GBPCHF
  • GBPJPY
  • GBPUSD
  • GOLD
  • NZDCAD
  • NZDCHF
  • NZDJPY
  • NZDUSD
  • SILVER
  • USDCAD
  • USDCHF
  • USDJPY
  • USDRUB
Timeframe
  • All
  • M5
  • M15
  • M30
  • H1
  • D1
Trend
  • All
  • Buy
  • Sale
Signal Strength
  • All
  • 1
  • 2
  • 3
  • 4
  • 5
Retângulo de baixa
was formed on 17.04 at 01:12:52 (UTC+0)
signal strength 1 of 5
Retângulo de baixa GBPCHF M5

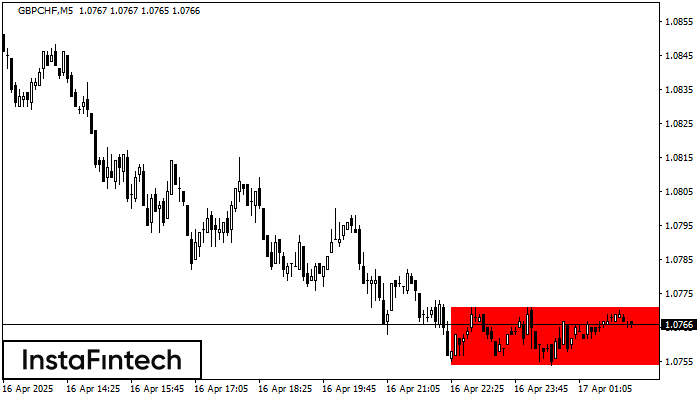
De acordo com o gráfico de M5, GBPCHF formou Retângulo de baixa. O padrão indica uma continuação da tendência. O limite superior é 1.0771, o limite inferior é 1.0754

Os intervalos M5 e M15 podem ter mais pontos de entrada falsos.

Open chart in a new window
Retângulo de baixa
was formed on 17.04 at 01:06:37 (UTC+0)
signal strength 1 of 5
Retângulo de baixa USDCHF M5

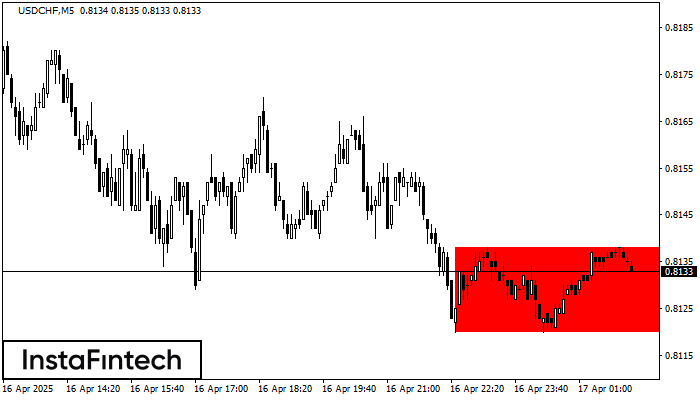
De acordo com o gráfico de M5, USDCHF formou Retângulo de baixa. O padrão indica uma continuação da tendência. O limite superior é 0.8138, o limite inferior é 0.8120

Os intervalos M5 e M15 podem ter mais pontos de entrada falsos.

Open chart in a new window
Triângulo Simétrico de Alta
was formed on 17.04 at 01:00:11 (UTC+0)
signal strength 1 of 5
Triângulo Simétrico de Alta GBPUSD M5

De acordo com o gráfico de M5, GBPUSD formaram o padrão de Triângulo Simétrico de Alta. Descrição: Este é o padrão de uma continuação de tendência. 1.3248 e 1.3228

Os intervalos M5 e M15 podem ter mais pontos de entrada falsos.

Open chart in a new window
Não pode falar agora?
Faça sua pergunta no chat.
Widget callback
 

Dear visitor,

Your IP address shows that you are currently located in the USA. If you are a resident of the United States, you are prohibited from using the services of InstaFintech Group including online trading, online transfers, deposit/withdrawal of funds, etc.

If you think you are seeing this message by mistake and your location is not the US, kindly proceed to the website. Otherwise, you must leave the website in order to comply with government restrictions.

Why does your IP address show your location as the USA?

  • - you are using a VPN provided by a hosting company based in the United States;
  • - your IP does not have proper WHOIS records;
  • - an error occurred in the WHOIS geolocation database.

Please confirm whether you are a US resident or not by clicking the relevant button below. If you choose the wrong option, being a US resident, you will not be able to open an account with InstaForex anyway.

We are sorry for any inconvenience caused by this message.