signal strength 1 of 5

According to the chart of M5, GBPAUD formed the Bullish Symmetrical Triangle pattern, which signals the trend will continue. Description. The upper border of the pattern touches the coordinates 2.0619/2.0611 whereas the lower border goes across 2.0603/2.0611. The pattern width is measured on the chart at 16 pips. If the Bullish Symmetrical Triangle pattern is in progress during the upward trend, this indicates the current trend will go on. In case 2.0611 is broken, the price could continue its move toward 2.0626.
The M5 and M15 time frames may have more false entry points.
Veja também
- All
- Double Top
- Flag
- Head and Shoulders
- Pennant
- Rectangle
- Triangle
- Triple top
- All
- #AAPL
- #AMZN
- #Bitcoin
- #EBAY
- #FB
- #GOOG
- #INTC
- #KO
- #MA
- #MCD
- #MSFT
- #NTDOY
- #PEP
- #TSLA
- #TWTR
- AUDCAD
- AUDCHF
- AUDJPY
- AUDUSD
- EURCAD
- EURCHF
- EURGBP
- EURJPY
- EURNZD
- EURRUB
- EURUSD
- GBPAUD
- GBPCHF
- GBPJPY
- GBPUSD
- GOLD
- NZDCAD
- NZDCHF
- NZDJPY
- NZDUSD
- SILVER
- USDCAD
- USDCHF
- USDJPY
- USDRUB
- All
- M5
- M15
- M30
- H1
- D1
- All
- Buy
- Sale
- All
- 1
- 2
- 3
- 4
- 5
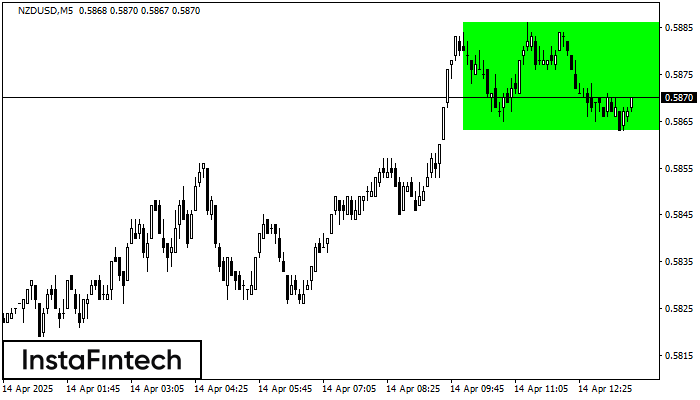
According to the chart of M5, NZDUSD formed the Bullish Rectangle. This type of a pattern indicates a trend continuation. It consists of two levels: resistance 0.5886 and support 0.5863
The M5 and M15 time frames may have more false entry points.
Open chart in a new window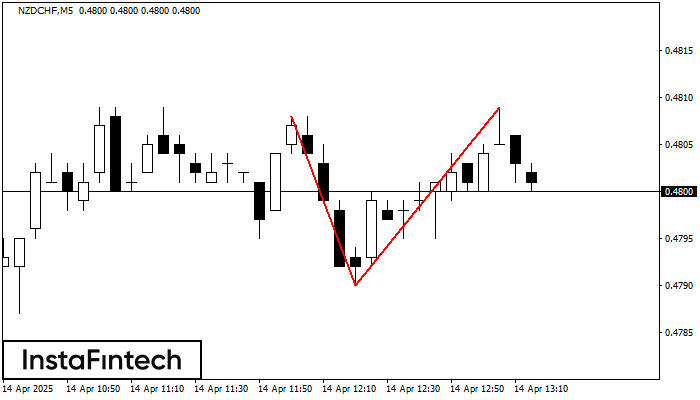
On the chart of NZDCHF M5 the Double Top reversal pattern has been formed. Characteristics: the upper boundary 0.4809; the lower boundary 0.4790; the width of the pattern 19 points
The M5 and M15 time frames may have more false entry points.
Open chart in a new window
According to the chart of M15, USDJPY formed the Inverse Head and Shoulder pattern. The Head’s top is set at 143.17 while the median line of the Neck is found
The M5 and M15 time frames may have more false entry points.
Open chart in a new window