empty
was formed on 28.03 at 12:14:49 (UTC+0)
signal strength 2 of 5
Head and Shoulders EURCAD M15

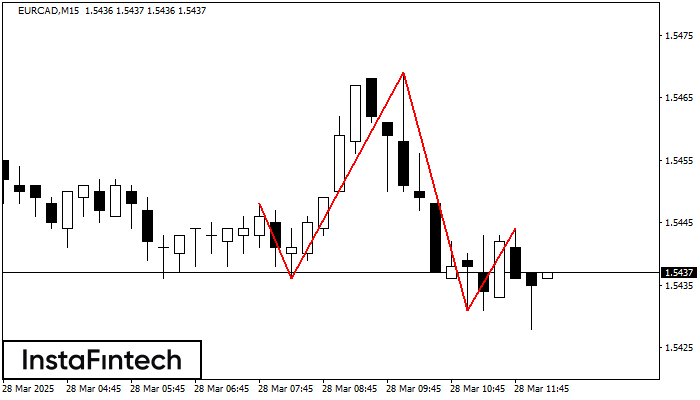
The technical pattern called Head and Shoulders has appeared on the chart of EURCAD M15. There are weighty reasons to suggest that the price will surpass the Neckline 1.5436/1.5431 after the right shoulder has been formed. So, the trend is set to change with the price heading for 1.5409.

The M5 and M15 time frames may have more false entry points.

Veja também

Figure
  • All
  • Double Top
  • Flag
  • Head and Shoulders
  • Pennant
  • Rectangle
  • Triangle
  • Triple top
Instrument
  • All
  • #AAPL
  • #AMZN
  • #Bitcoin
  • #EBAY
  • #FB
  • #GOOG
  • #INTC
  • #KO
  • #MA
  • #MCD
  • #MSFT
  • #NTDOY
  • #PEP
  • #TSLA
  • #TWTR
  • AUDCAD
  • AUDCHF
  • AUDJPY
  • AUDUSD
  • EURCAD
  • EURCHF
  • EURGBP
  • EURJPY
  • EURNZD
  • EURRUB
  • EURUSD
  • GBPAUD
  • GBPCHF
  • GBPJPY
  • GBPUSD
  • GOLD
  • NZDCAD
  • NZDCHF
  • NZDJPY
  • NZDUSD
  • SILVER
  • USDCAD
  • USDCHF
  • USDJPY
  • USDRUB
Timeframe
  • All
  • M5
  • M15
  • M30
  • H1
  • D1
Trend
  • All
  • Buy
  • Sale
Signal Strength
  • All
  • 1
  • 2
  • 3
  • 4
  • 5
Retângulo de alta
was formed on 14.04 at 13:01:10 (UTC+0)
signal strength 1 of 5
Retângulo de alta AUDCHF M5

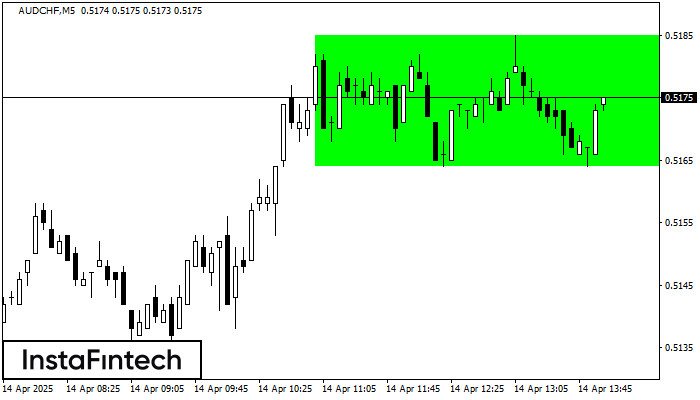
De acordo com o gráfico de M5, AUDCHF formou Retângulo de alta. O padrão indica uma continuação da tendência. O limite superior é 0.5185, o limite inferior é 0.5164

Os intervalos M5 e M15 podem ter mais pontos de entrada falsos.

Open chart in a new window
Fundo duplo
was formed on 14.04 at 13:00:23 (UTC+0)
signal strength 4 of 5
Fundo duplo USDJPY H1

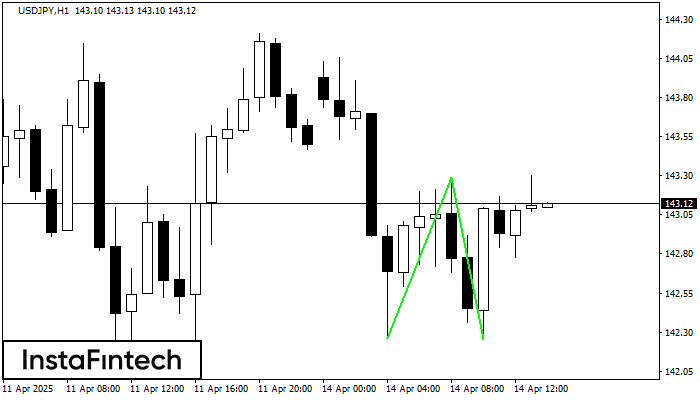
O padrão Fundo duplo foi formado em USDJPY H1. Características: o nível de suporte 142.26; o nível de resistência 143.29; a largura do padrão 103 pontos. Se o nível

Open chart in a new window
Triângulo Simétrico de Alta
was formed on 14.04 at 12:56:06 (UTC+0)
signal strength 1 of 5
Triângulo Simétrico de Alta NZDJPY M5

De acordo com o gráfico de M5, NZDJPY formaram o padrão de Triângulo Simétrico de Alta. Descrição: Este é o padrão de uma continuação de tendência. 84.17 e 83.88

Os intervalos M5 e M15 podem ter mais pontos de entrada falsos.

Open chart in a new window
Não pode falar agora?
Faça sua pergunta no chat.
Widget callback
 

Dear visitor,

Your IP address shows that you are currently located in the USA. If you are a resident of the United States, you are prohibited from using the services of InstaFintech Group including online trading, online transfers, deposit/withdrawal of funds, etc.

If you think you are seeing this message by mistake and your location is not the US, kindly proceed to the website. Otherwise, you must leave the website in order to comply with government restrictions.

Why does your IP address show your location as the USA?

  • - you are using a VPN provided by a hosting company based in the United States;
  • - your IP does not have proper WHOIS records;
  • - an error occurred in the WHOIS geolocation database.

Please confirm whether you are a US resident or not by clicking the relevant button below. If you choose the wrong option, being a US resident, you will not be able to open an account with InstaForex anyway.

We are sorry for any inconvenience caused by this message.