signal strength 1 of 5
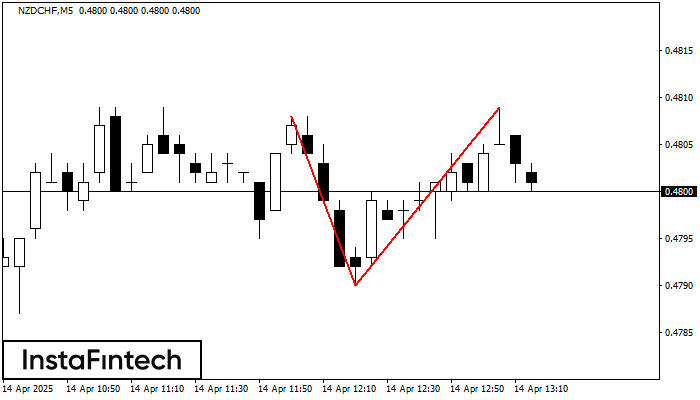
On the chart of NZDCHF M5 the Double Top reversal pattern has been formed. Characteristics: the upper boundary 0.4809; the lower boundary 0.4790; the width of the pattern 19 points. The signal: a break of the lower boundary will cause continuation of the downward trend targeting the 0.4775 level.
The M5 and M15 time frames may have more false entry points.
یہ بھی دیکھیں
- All
- Double Top
- Flag
- Head and Shoulders
- Pennant
- Rectangle
- Triangle
- Triple top
- All
- #AAPL
- #AMZN
- #Bitcoin
- #EBAY
- #FB
- #GOOG
- #INTC
- #KO
- #MA
- #MCD
- #MSFT
- #NTDOY
- #PEP
- #TSLA
- #TWTR
- AUDCAD
- AUDCHF
- AUDJPY
- AUDUSD
- EURCAD
- EURCHF
- EURGBP
- EURJPY
- EURNZD
- EURRUB
- EURUSD
- GBPAUD
- GBPCHF
- GBPJPY
- GBPUSD
- GOLD
- NZDCAD
- NZDCHF
- NZDJPY
- NZDUSD
- SILVER
- USDCAD
- USDCHF
- USDJPY
- USDRUB
- All
- M5
- M15
- M30
- H1
- D1
- All
- Buy
- Sale
- All
- 1
- 2
- 3
- 4
- 5
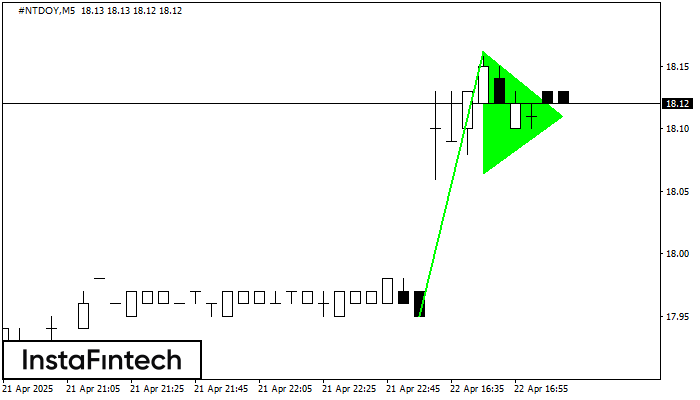
The Bullish pennant signal – Trading instrument #NTDOY M5, continuation pattern. Forecast: it is possible to set up a buy position above the pattern’s high of 18.16, with the prospect
The M5 and M15 time frames may have more false entry points.
Open chart in a new window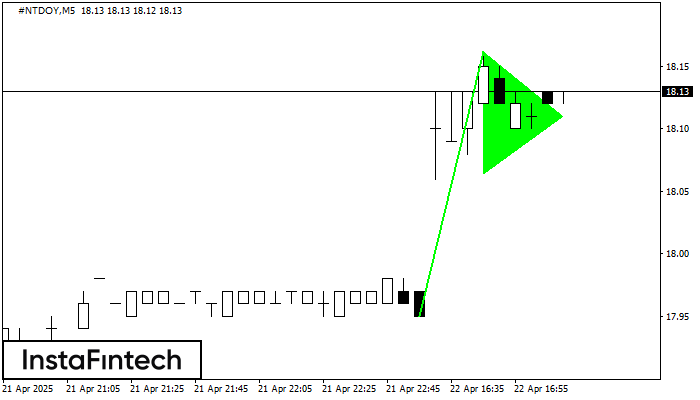
The Bullish pennant signal – Trading instrument #NTDOY M5, continuation pattern. Forecast: it is possible to set up a buy position above the pattern’s high of 18.16, with the prospect
The M5 and M15 time frames may have more false entry points.
Open chart in a new window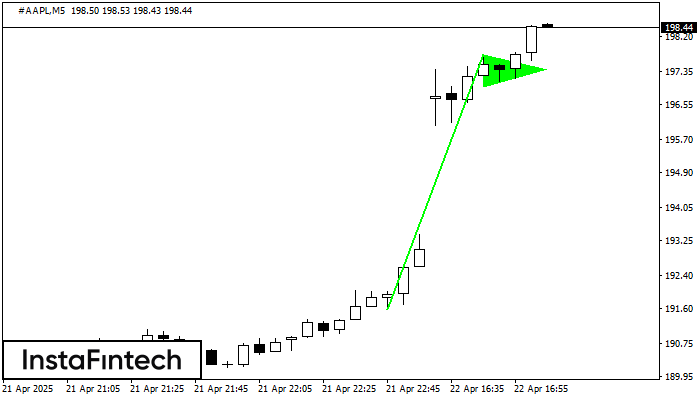
The Bullish pennant signal – Trading instrument #AAPL M5, continuation pattern. Forecast: it is possible to set up a buy position above the pattern’s high of 197.78, with the prospect
The M5 and M15 time frames may have more false entry points.
Open chart in a new window