empty
23.01.2024 10:25 AM
EUR/USD and GBP/USD: trading tips for beginners on January 23

Details of economic calendar on January 22

The economic calendar commonly lacks high-impact economic data on Monday. Yesterday was no exception. The US, the UK, and the EU did not release any economic reports.

Analysis of technical charts on January 22

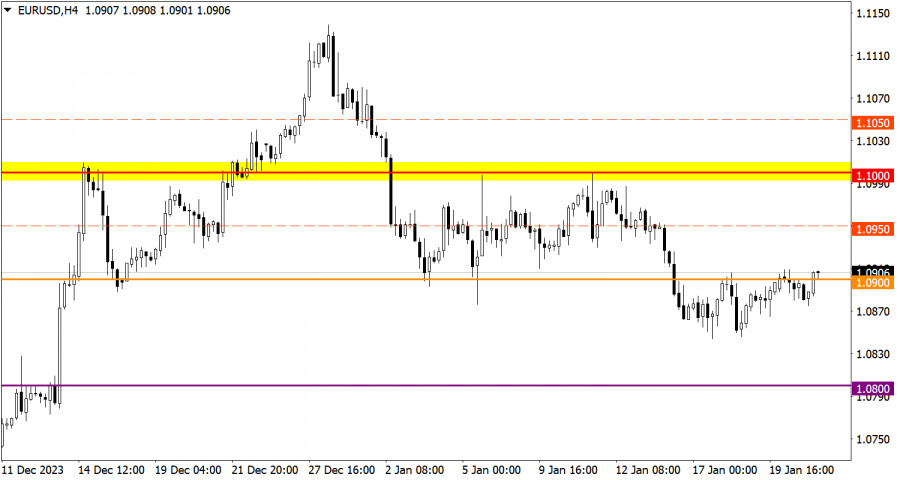
The EUR/USD pair has been moving around the 1.0900 level for the third day in a row with low trading activity. The level of 1.0850 serves as a variable support on the path of sellers. At this level, there was a reduction in short positions on EUR/USD.

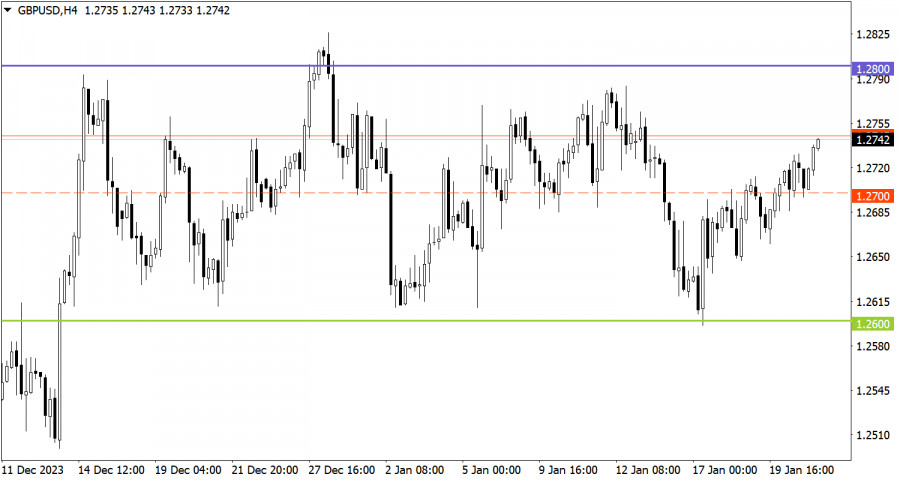
The GBP/USD currency pair is trading within the sideways channel of 1.2600/1.2800, consistently approaching the defined borders. At the moment, we see the consolidation above the average level of 1.2700, which indicates an increase in long positions on the range-bound market.

This image is no longer relevant

Economic calendar on January 23

Today the economic calendar is equally empty as on Monday. No macroeconomic data will be released in the US, the UK, and the EU.

Trading plan for EUR/USD on January 23

Consolidation of the price above 1.0900 during the day may lead to an increase in the volume of long positions in the direction towards 1.1000. As for the bearish scenario, it will come into play if the price drops below 1.0850.

This image is no longer relevant

Trading plan for GBP/USD on January 23

In this situation, we may go ahead trading within the borders of the sideways channel. We reckon the instrument could approach the upper border at 1.2800.

However, we should not forget that the range-bound market is a temporary pattern, which leads to the accumulation of trading forces and abundant attention from speculators. As a result, the instrument will gain a certain momentum and break any of the borders. When the flat market is over, the price will indicate a further direction in the market. For this reason, you should always consider the breakout strategy.

This image is no longer relevant

What's on charts

The candlestick chart type consists of graphic rectangles in white and black with lines at the top and bottom. With a detailed analysis of each individual candle, you can see its characteristics relative to a particular time frame: opening price, closing price, maximum and minimum price.

Horizontal levels are price coordinates relative to which a price may stop or revered its trajectory. In the market, these levels are called support and resistance.

Circles and rectangles are highlighted examples where the price developed. This color highlighting indicates horizontal lines that may put pressure on the price in the future.

Up/down arrows are guidelines for possible price direction in the future.

Gven Podolsky,
انسٹافاریکس کا تجزیاتی ماہر
© 2007-2025
ٹائم فریم منتخب کریں
5
منٹ
15
منٹ
30
منٹ
1
گھنٹہ
4
گھنٹے
1
دن
1
ہفتہ
انسٹافاریکس کے ساتھ کرپٹو کرنسی کی معاملاتی تبدیلیوں سے کمائیں۔
میٹا ٹریڈر 4 ڈاؤن لوڈ کریں اور اپنی پہلی ٹریڈ کھولیں۔
  • چانسی ڈیپازٹ
    اپنے اکاؤنٹ میں 3000 ڈالر جمع کروائیں اور حاصل کریں$1000 مزید!
    ہم اپریل قرعہ اندازی کرتے ہیں $1000چانسی ڈیپازٹ نامی مقابلہ کے تحت
    اپنے اکاؤنٹ میں 3000 ڈالر جمع کروانے پر موقع حاصل کریں - اس شرط پر پورا اُترتے ہوئے اس مقابلہ میں شرکت کریں
    مقابلہ میں شامل ہوں

تجویز کردہ مضامین

4 اپریل کو برطانوی پاؤنڈ/امریکی ڈالر کے پیئر کی تجارت کیسے کی جائے؟ نئے تاجروں کے لیے آسان تجاویز اور تجارتی تجزیہ

جمعرات کی تجارت کا تجزیہ برطانوی پاؤنڈ/امریکی ڈالر کا 1 گھنٹے چارٹ جمعرات کو برطانوی پاؤنڈ/امریکی ڈالر جوڑی نے بھی اوپر کی طرف ایک مضبوط حرکت دکھائی۔ EUR سے متعلقہ

Paolo Greco 13:56 2025-04-04 UTC+2

4 اپریل کو یورو/امریکی ڈالر کے جوڑے کی تجارت کیسے کی جائے؟ نئے تاجروں کے لیے آسان تجاویز اور تجارتی تجزیہ

جمعرات کی تجارت کا تجزیہ یورو/امریکی ڈالر کا 1 گھنٹے چارٹ یورو/امریکی ڈالر کرنسی کے جوڑے نے جمعرات کو ایک مضبوط اوپر کی حرکت پوسٹ کی۔ اس صورتحال

Paolo Greco 13:52 2025-04-04 UTC+2

4 پر برطانوی پاؤنڈ/امریکی ڈالر کے لیے تجارتی سفارشات اور تجزیہ: کیا پاول صورتحال کو ٹھیک کر سکتا ہے؟

برطانوی پاؤنڈ/امریکی ڈالر کا 5 منٹ کا تجزیہ جمعرات کو برطانوی پاؤنڈ/امریکی ڈالر کی کرنسی کے جوڑے نے بھی اوپر کی طرف ایک مضبوط حرکت دکھائی۔ قدرتی طور پر،

Paolo Greco 13:46 2025-04-04 UTC+2

4 اپریل کو یورو/امریکی ڈالر کے لیے تجارتی سفارشات اور تجزیہ: مارکیٹ میں نیا خوف

یورو/امریکی ڈالر کا 5 منٹ کا تجزیہ یورو/امریکی ڈالر کرنسی کے جوڑے نے جمعرات کو مضبوط اوپر کی حرکت دکھائی۔ سچ کہوں تو ہم پچھلے دو مہینوں

Paolo Greco 13:38 2025-04-04 UTC+2

3 اپریل کو یورو/امریکی ڈالر کے جوڑے کی تجارت کیسے کی جائے؟ نئے تاجروں کے لیے آسان تجاویز اور تجارتی تجزیہ

بدھ کی تجارت کا تجزیہ یورو/امریکی ڈالر کا 1 گھنٹے چارٹ یورو/امریکی ڈالر کرنسی کے جوڑے نے بدھ کو فائدہ کے ساتھ تجارت کی، حالانکہ اس کا میکرو اکنامک

Paolo Greco 13:44 2025-04-03 UTC+2

3 اپریل کو برطانوی پاؤنڈ/امریکی ڈالر کے لیے تجارتی سفارشات اور تجزیہ: برطانوی پاؤنڈ فلیٹ رینج میں رہتا ہے

برطانوی پاؤنڈ/امریکی ڈالر کا 5 منٹ کا تجزیہ برطانوی پاؤنڈ/امریکی ڈالر کرنسی جوڑی نے بدھ کے روز سائیڈ وے چینل کے اندر تجارت جاری رکھی۔ گزشتہ دو ہفتوں کے دوران،

Paolo Greco 13:32 2025-04-03 UTC+2

3 اپریل کو یورو/امریکی ڈالر کے لیے تجارتی سفارشات اور تجزیہ: کوئی ٹیرف، کوئی حرکت نہیں

یورو/امریکی ڈالر کا 5 منٹ کا تجزیہ یورو/امریکی ڈالر کرنسی کے جوڑے نے بدھ کو تجارت کی جیسا کہ اس نے پیر اور منگل کو کیا تھا۔ دن کے بیشتر

Paolo Greco 13:25 2025-04-03 UTC+2

2 اپریل کو برطانوی پاؤنڈ/امریکی ڈالر کے پیئر کی تجارت کیسے کی جائے؟ نئے تاجروں کے لیے آسان تجاویز اور تجارتی تجزیہ

منگل کی تجارت کا تجزیہ برطانوی پاؤنڈ/امریکی ڈالر کا 1 گھنٹے چارٹ منگل کو، برطانوی پاؤنڈ/امریکی ڈالر جوڑی نے ایک فلیٹ رینج کے اندر تجارت جاری رکھی، جیسا

Paolo Greco 13:28 2025-04-02 UTC+2

2 اپریل کو یورو/امریکی ڈالر کے جوڑے کی تجارت کیسے کی جائے؟ نئے تاجروں کے لیے آسان تجاویز اور تجارتی تجزیہ

منگل کی تجارت کا تجزیہ یورو/امریکی ڈالر کا 1 گھنٹے چارٹ منگل کو، یورو/امریکی ڈالر کرنسی جوڑے نے پچھلے ہفتوں کی طرح اسی موڈ میں تجارت جاری رکھی۔

Paolo Greco 13:25 2025-04-02 UTC+2

2 اپریل کو یورو/امریکی ڈالر کے لیے تجارتی سفارشات اور تجزیہ: پیر خاموشی سے منگل میں پھسل گیا

یورو/امریکی ڈالر کا 5 منٹ کا تجزیہ یورو/امریکی ڈالر کرنسی کے جوڑے نے منگل کو اسی طرح تجارت کی جس طرح پیر کو تھی۔ کل، ہم نے خبردار

Paolo Greco 13:13 2025-04-02 UTC+2
ابھی فوری بات نہیں کرسکتے ؟
اپنا سوال پوچھیں بذریعہ چیٹ.
Widget callback
 

Dear visitor,

Your IP address shows that you are currently located in the USA. If you are a resident of the United States, you are prohibited from using the services of InstaFintech Group including online trading, online transfers, deposit/withdrawal of funds, etc.

If you think you are seeing this message by mistake and your location is not the US, kindly proceed to the website. Otherwise, you must leave the website in order to comply with government restrictions.

Why does your IP address show your location as the USA?

  • - you are using a VPN provided by a hosting company based in the United States;
  • - your IP does not have proper WHOIS records;
  • - an error occurred in the WHOIS geolocation database.

Please confirm whether you are a US resident or not by clicking the relevant button below. If you choose the wrong option, being a US resident, you will not be able to open an account with InstaForex anyway.

We are sorry for any inconvenience caused by this message.