signal strength 3 of 5
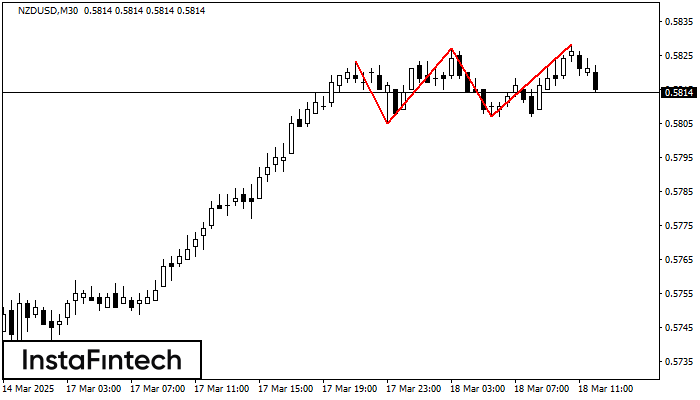
The Triple Top pattern has formed on the chart of the NZDUSD M30. Features of the pattern: borders have an ascending angle; the lower line of the pattern has the coordinates 0.5805/0.5807 with the upper limit 0.5823/0.5828; the projection of the width is 18 points. The formation of the Triple Top figure most likely indicates a change in the trend from upward to downward. This means that in the event of a breakdown of the support level of 0.5805, the price is most likely to continue the downward movement.
Lihat juga
- All
- Double Top
- Flag
- Head and Shoulders
- Pennant
- Rectangle
- Triangle
- Triple top
- All
- #AAPL
- #AMZN
- #Bitcoin
- #EBAY
- #FB
- #GOOG
- #INTC
- #KO
- #MA
- #MCD
- #MSFT
- #NTDOY
- #PEP
- #TSLA
- #TWTR
- AUDCAD
- AUDCHF
- AUDJPY
- AUDUSD
- EURCAD
- EURCHF
- EURGBP
- EURJPY
- EURNZD
- EURRUB
- EURUSD
- GBPAUD
- GBPCHF
- GBPJPY
- GBPUSD
- GOLD
- NZDCAD
- NZDCHF
- NZDJPY
- NZDUSD
- SILVER
- USDCAD
- USDCHF
- USDJPY
- USDRUB
- All
- M5
- M15
- M30
- H1
- D1
- All
- Buy
- Sale
- All
- 1
- 2
- 3
- 4
- 5
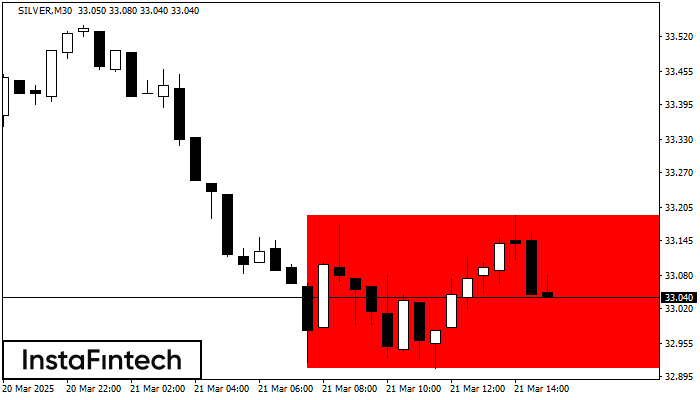
Menurut grafik dari M30, SILVER terbentuk Persegi Bearish. Pola menunjukkan kelanjutan tren. Batas atas adalah 33.19, batas rendah adalah 32.91. Sinyal berarti posisi jual harus dibuka setelah menetapkan harga dibawah
Open chart in a new window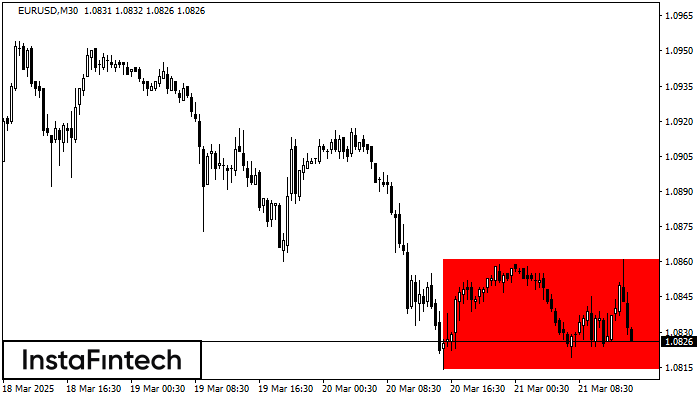
Menurut grafik dari M30, EURUSD terbentuk Persegi Bearish. Pola menunjukkan kelanjutan tren. Batas atas adalah 1.0861, batas rendah adalah 1.0814. Sinyal berarti posisi jual harus dibuka setelah menetapkan harga dibawah
Open chart in a new window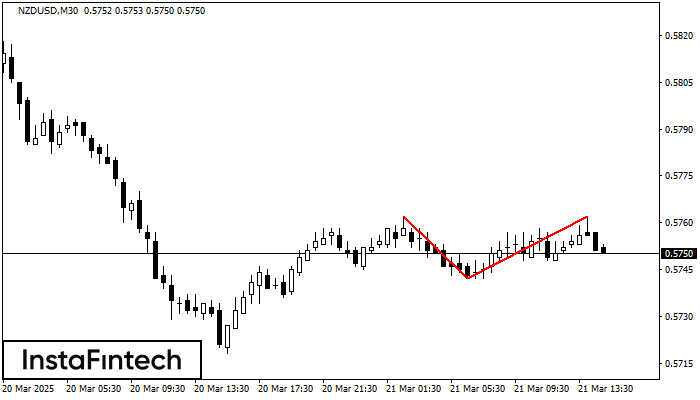
Pola Teratas Ganda telah terbentuk pada NZDUSD M30. Pola ini menandakan bahwa tren telah berubah dari kenaikan menjadi penurunan. Mungkin, jika dasar pola di 0.5742 ditembus, maka pergerakan menurun akan
Open chart in a new window