signal strength 1 of 5
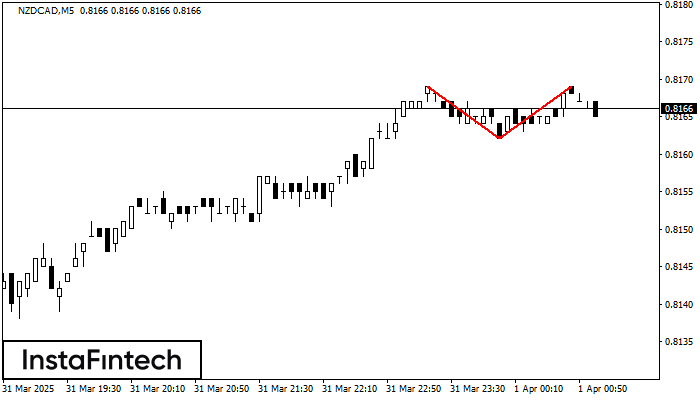
The Double Top pattern has been formed on NZDCAD M5. It signals that the trend has been changed from upwards to downwards. Probably, if the base of the pattern 0.8162 is broken, the downward movement will continue.
The M5 and M15 time frames may have more false entry points.
- All
- Double Top
- Flag
- Head and Shoulders
- Pennant
- Rectangle
- Triangle
- Triple top
- All
- #AAPL
- #AMZN
- #Bitcoin
- #EBAY
- #FB
- #GOOG
- #INTC
- #KO
- #MA
- #MCD
- #MSFT
- #NTDOY
- #PEP
- #TSLA
- #TWTR
- AUDCAD
- AUDCHF
- AUDJPY
- AUDUSD
- EURCAD
- EURCHF
- EURGBP
- EURJPY
- EURNZD
- EURRUB
- EURUSD
- GBPAUD
- GBPCHF
- GBPJPY
- GBPUSD
- GOLD
- NZDCAD
- NZDCHF
- NZDJPY
- NZDUSD
- SILVER
- USDCAD
- USDCHF
- USDJPY
- USDRUB
- All
- M5
- M15
- M30
- H1
- D1
- All
- Buy
- Sale
- All
- 1
- 2
- 3
- 4
- 5
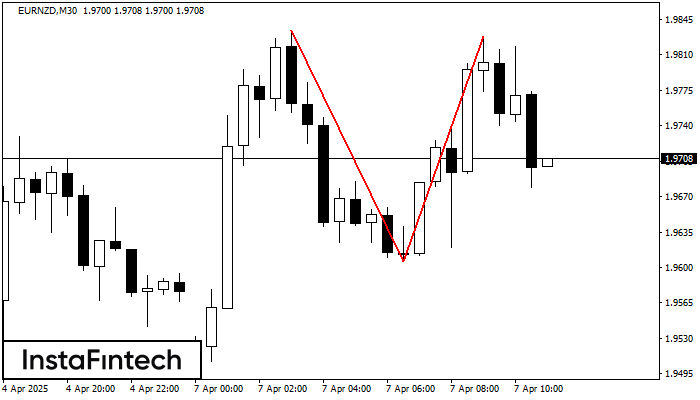
On the chart of EURNZD M30 the Double Top reversal pattern has been formed. Characteristics: the upper boundary 1.9828; the lower boundary 1.9606; the width of the pattern 222 points
Open chart in a new window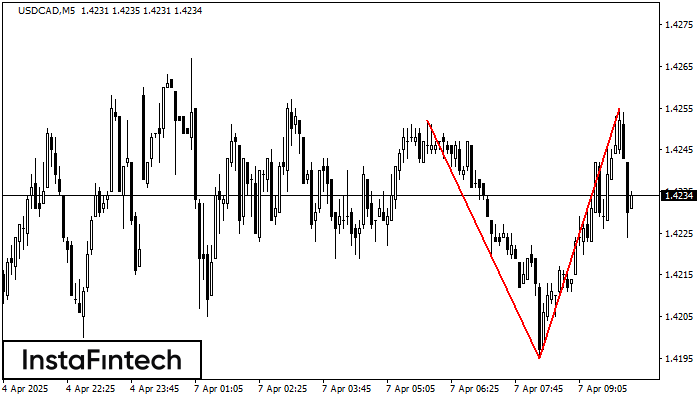
On the chart of USDCAD M5 the Double Top reversal pattern has been formed. Characteristics: the upper boundary 1.4255; the lower boundary 1.4195; the width of the pattern 60 points
The M5 and M15 time frames may have more false entry points.
Open chart in a new window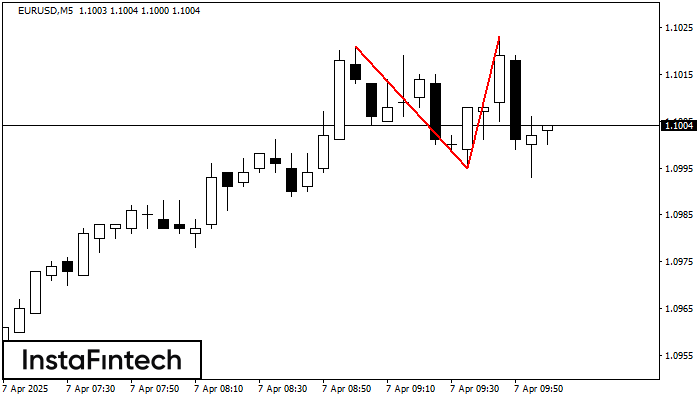
On the chart of EURUSD M5 the Double Top reversal pattern has been formed. Characteristics: the upper boundary 1.1023; the lower boundary 1.0995; the width of the pattern 28 points
The M5 and M15 time frames may have more false entry points.
Open chart in a new window