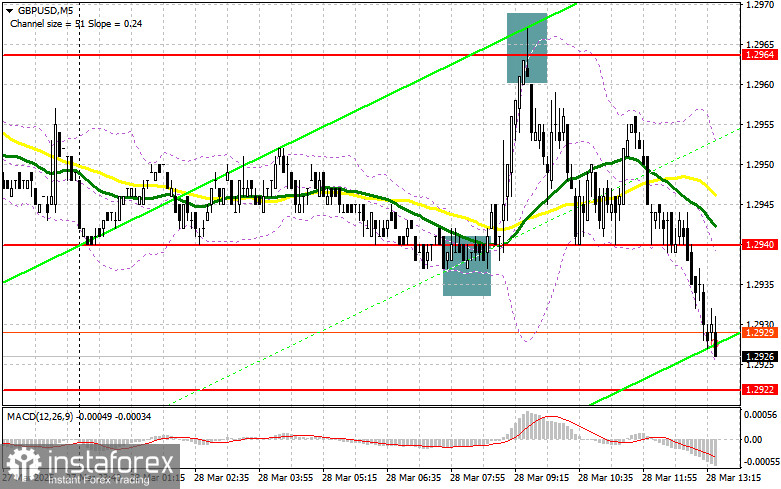
In my morning forecast, I focused on the level of 1.2964 and planned to make market entry decisions based on it. Let's look at the 5-minute chart and break down what happened. A rise and a false breakout around 1.2964 led to a sell signal for the pound, which resulted in a decline to the morning support level of 1.2940, from which I had previously bought GBP/USD at the start of the European session. The technical picture was revised for the second half of the day.
To open long positions on GBP/USD:
Buyers of the pound didn't get to celebrate for long after the UK's Q4 GDP was revised upward and February retail sales exceeded economists' forecasts. After the surge toward 1.2964, pressure on the pair resumed. But things could still change ahead. The core personal consumption expenditures (PCE) index is the main data point traders and the Fed are focusing on. A weaker reading would undermine the dollar and renew demand for the pound. Otherwise, the pair may continue falling into the end of the week. Also in focus are data on changes in U.S. consumer spending and income, as well as consumer sentiment and inflation expectations from the University of Michigan. If the pair declines, I prefer to act near the nearest support at 1.2922, formed yesterday. A false breakout there would provide a good entry point into long positions targeting a return to resistance at 1.2943. A breakout and retest of this range from top to bottom would form a new buy signal with potential for an update of 1.2964. The final target will be the area around 1.2988, where I plan to take profit. If GBP/USD drops and there's no buyer activity at 1.2922 in the second half of the day, pressure on the pound could return to cap the pair within a sideways channel. In that case, a false breakout around 1.2901 would be a good condition for opening long positions. I also plan to buy GBP/USD on a rebound from support at 1.2885, aiming for a 30–35 point intraday correction.
To open short positions on GBP/USD:
Sellers of the pound made a timely move, reapplying pressure on the pair and significantly limiting the odds of a continued bullish trend. If U.S. data disappoints and GBP/USD rises, only a false breakout around 1.2943 would be a suitable entry point for short positions aiming for a drop to new support at 1.2922. This level also aligns with the moving averages that currently favor the bulls. A breakout and retest of this range from below would trigger stop-losses and open the path to 1.2901, negating any efforts by buyers to return to the market. The final target will be 1.2885, where I plan to take profit. Testing this level will reestablish a bearish market. If demand for the pound returns in the second half of the day and bears show no activity around 1.2943, it's better to postpone short positions until resistance at 1.2964 is tested. I'll sell there only after a false breakout. If there's no downside movement from that level either, I'll look to short from 1.2988, but only with the aim of a 30–35 point intraday correction.
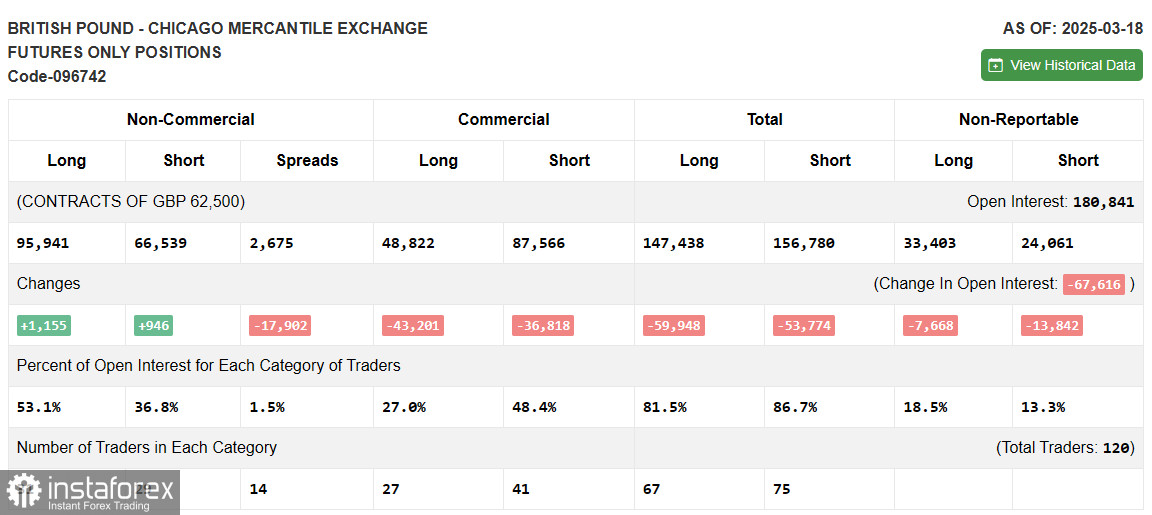
COT Report (Commitment of Traders) for March 18:
The report showed growth in both long and short positions, but the increase in long positions was significantly larger, giving pound buyers a stronger edge. This is also reflected in the GBP/USD chart. Following the Bank of England's meeting, it became clear that the central bank is taking a more gradual approach to rate cuts, and it's possible their stance could grow even more hawkish going forward. Many are alarmed by Trump's actions and trade tariffs, which may lead to a spike in inflation—already a problem in the UK. The Bank of England's current position is supporting pound buyers and will likely continue to do so. The latest COT report shows that long non-commercial positions rose by 1,155 to 95,941, while short non-commercial positions increased by just 946 to 66,539. As a result, the net long position narrowed by 17,902.
Indicator signals:
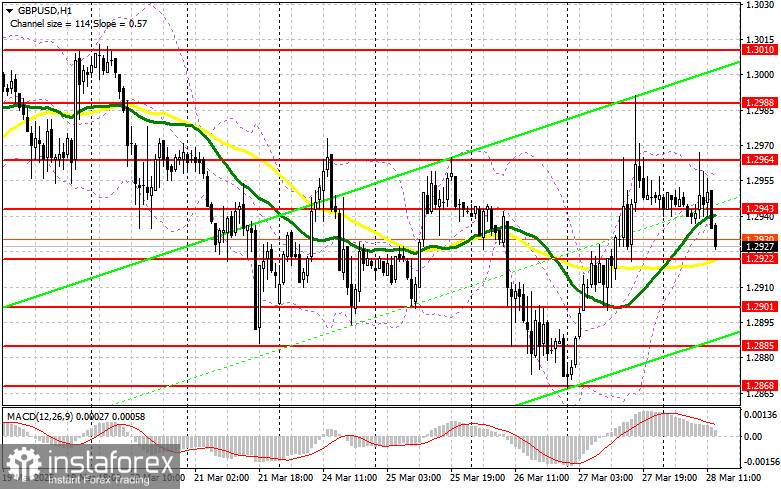
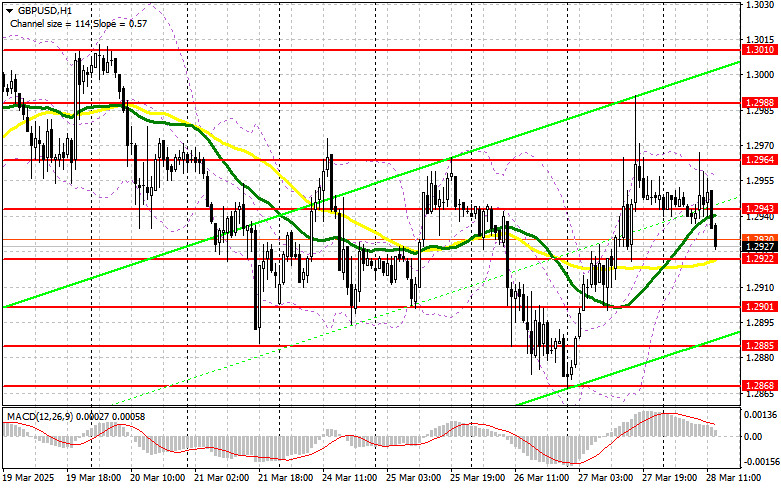
Moving Averages: Trading is occurring around the 30- and 50-period moving averages, indicating market uncertainty.
Note: The author uses hourly (H1) chart settings for moving averages, which differ from the classic daily (D1) definitions.
Bollinger Bands: If the pair declines, the lower boundary of the indicator around 1.2940 will serve as support.
Indicator descriptions: • Moving average (MA): identifies the current trend by smoothing volatility and noise. Period – 50, shown in yellow on the chart. • Moving average (MA): identifies the current trend by smoothing volatility and noise. Period – 30, shown in green on the chart. • MACD (Moving Average Convergence/Divergence): Fast EMA – 12, Slow EMA – 26, SMA – 9. • Bollinger Bands: Period – 20. • Non-commercial traders: Speculators such as individual traders, hedge funds, and large institutions that use the futures market for speculative purposes and meet specific criteria. • Long non-commercial positions: Total long open positions held by non-commercial traders. • Short non-commercial positions: Total short open positions held by non-commercial traders. • Net non-commercial position: The difference between short and long positions held by non-commercial traders.