GBP/USD 5-Minute Analysis
The GBP/USD currency pair experienced a slight pullback on Thursday but did not manage to consolidate below the critical line. The Kijun-sen line is situated very close to the current price. There were no macroeconomic reports released in the UK on Thursday, and while there was some U.S. data, any market reaction was minimal, barely noticeable even on the five-minute timeframe. Meanwhile, Donald Trump continues to make threats against the European Union and Canada; however, the market is becoming increasingly indifferent to his statements. If the forex market was uncertain before, it is even more tumultuous now, raising questions about whether it has finished responding to Trump's sanctions and tariffs or if further developments are expected.
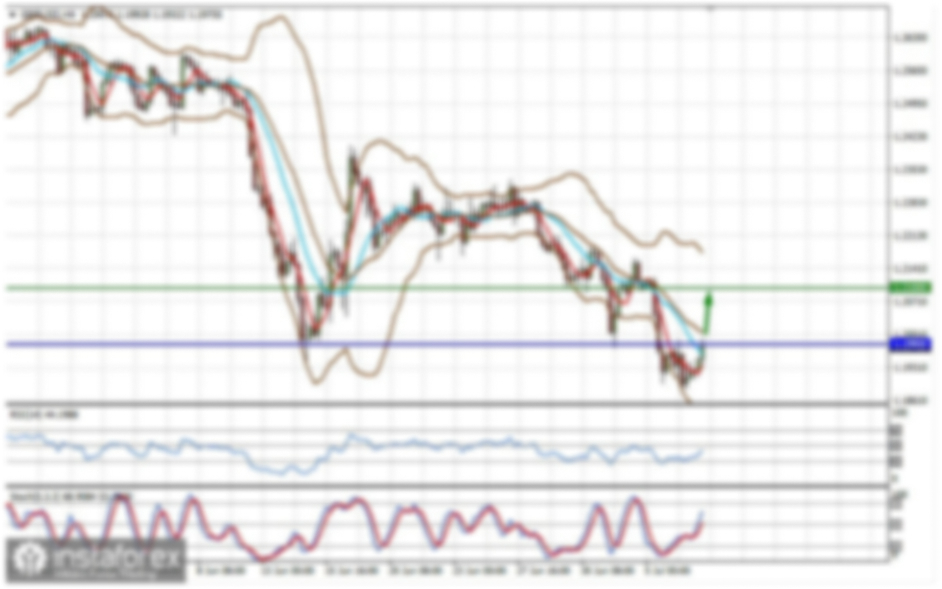
From a technical standpoint, the situation remains unclear. There is no discernible trend line or channel. A consolidation below the critical level could trigger a small decline, but breaking below 1.2863 would require considerable effort. Interestingly, aside from Trump's statements, the British pound lacks strong reasons to appreciate against the U.S. dollar. This suggests that the current upward trend could abruptly end, leading to a new decline. The downward trends on both the daily and monthly timeframes remain unchanged.
On the five-minute timeframe, there was only one trading signal on Thursday. At the beginning of the U.S. session, the price bounced off the Kijun-sen line and moved up by 30 pips. Although it did not reach the nearest target, traders could have secured a profit of 10-15 pips if they chose to close their positions manually in the evening.
COT Report
COT reports for the British pound indicate that the sentiment among commercial traders has been fluctuating in recent years. The red and blue lines, representing the net positions of commercial and non-commercial traders, frequently intersect and typically hover around the zero line. Currently, these lines are close to each other, indicating a roughly equal number of buy and sell positions.
On the weekly timeframe, the price initially broke the 1.3154 level before dropping to the trend line, which it subsequently broke through. This break suggests that the pound's decline is likely to continue. However, there was also a bounce from the second-to-last local low on the weekly chart, which could imply a flat market.
According to the latest COT report on the British pound, the "Non-commercial" group opened 7,800 buy contracts and closed 6,300 sell contracts. Consequently, the net position of non-commercial traders increased by 14,100 contracts over the week, which does not significantly favor the pound.
The fundamental backdrop still offers no solid reasons for long-term investments in the British pound, and the currency faces a real possibility of continuing its global downtrend. Although the pound has recently experienced a notable increase, the underlying cause appears to be related to Donald Trump's policies.
GBP/USD 1-Hour Analysis
On the hourly timeframe, GBP/USD remains in an uptrend. This may not be the last trend shift within the ongoing upward correction on the daily timeframe, but this correction has long been due to end. We still don't see any fundamental reasons for the pound to rise long-term. Currently, the only thing supporting the pound is Donald Trump, who continues imposing sanctions and tariffs on almost everyone except the UK. All other market factors are being ignored.
For March 14, the key levels to watch are 1.2237-1.2255, 1.2331-1.2349, 1.2429-1.2445, 1.2511, 1.2605-1.2620, 1.2691-1.2701, 1.2796-1.2816, 1.2863, 1.2981-1.2987, 1.3050. The Senkou Span B (1.2749) and Kijun-sen (1.2922) lines may also act as signal points. The Stop Loss should be set at breakeven once the price moves 20 pips in the right direction. The Ichimoku indicator lines may shift during the day, so traders should consider this when identifying signals.
The UK will release reports on monthly GDP and industrial production on Friday. The industrial production report is even more important than GDP in this case. A monthly GDP report is not the same as a quarterly one, so it holds little significance. In the U.S., the University of Michigan Consumer Sentiment Index will be released, but it is also not a highly influential report.
Illustration Explanations:
- Support and Resistance Levels (thick red lines): Thick red lines indicate where movement may come to an end. Please note that these lines are not sources of trading signals.
- Kijun-sen and Senkou Span B Lines: Ichimoku indicator lines transferred from the 4-hour timeframe to the hourly timeframe. These are strong lines.
- Extreme Levels (thin red lines): Thin red lines where the price has previously bounced. These serve as sources of trading signals.
- Yellow Lines: Trendlines, trend channels, or any other technical patterns.
- Indicator 1 on COT Charts: Represents the net position size for each category of traders.