empty
13.01.2022 06:12 PM
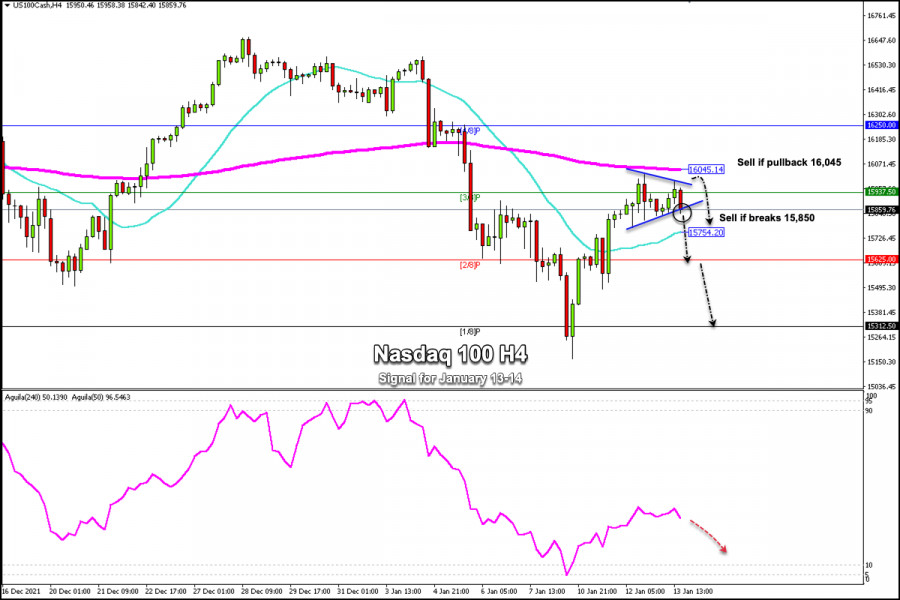
Trading signals for Nasdaq 100 (#NDX) on January 13 - 14, 2022: sell in case of breaks of symmetrical triangle at 15,850 points

This image is no longer relevant

From its low of 15,162, the Nasdaq 100 technology index (#NDX) has managed to reach the top of the 200 EMA located at 16,045. Right now, it is consolidating and forming a pattern of a symmetrical triangle. A break below this pattern could be the start of a bearish move towards 2/8 Murray (15.625) and towards the support 1/8 around 15,312.

On the other hand, a pullback towards the 200 EMA around 16.045 will be an opportunity to sell, only if the price falls below this zone.

As the Fed confirmed its agenda for raising interets rates this year, this outlook could weaken the Nasdaq 100 index and we could expect its drop towards the psychological level of 15,000 points.

According to the daily chart, the main trend of NDX is still bearish. According to the 4-hour chart, we also notice a downtrend. Given that it is trading below the 200 EMA, this bounce will be considered a technical correction to give us the opportunity to sell in the next few days with targets at 15,160.

A consolidation in daily charts above the psychological level of 16,000 points will be the beginning of a bullish movement and we could expect the index to reach the all-time high of 16,767.

As long as it remains trading below 4/8 Murray located at 16,250, the Nasdaq will struggle for a new uptrend. Therefore, if in the next days it approaches this area, it will give us an opportunity to continue selling and expect a sustained decline in the medium term.

Support and Resistance Levels for January 13 - 14, 2022

Resistance (3) 16,250

Resistance (2) 16,146

Resistance (1) 15,937

----------------------------

Support (1) 15,780

Support (2) 15,625

Support (3) 15,533

***********************************************************


Scenario

Timeframe H4

Recommendation: sell if breaks

Entry Point 15,850

Take Profit 15,754 (21 SMA), 15,625 (2/8) 15,312 (1/8).

Stop Loss 15,930

Murray Levels 16,250 (4/8) 15,937 (3/8) 15,625 (2/8) 15,312 (1/8)

***********************************************************

Dimitrios Zappas,
Analytical expert of InstaForex
© 2007-2025
选择时间框架
5
分钟
15
分钟
30
分钟
1
小时
4
小时
1
1
通过InstaForex赚取加密货币汇率变动的收益。
下载MetaTrader 4并开启您的第一笔交易。
  • Grand Choice
    Contest by
    InstaForex
    InstaForex always strives to help you
    fulfill your biggest dreams.
    JOIN CONTEST

推荐文章

美國股市顯示出溫和增長

S&P 500 3月26日股市更新 週二美國股市指數快照: * 道瓊指數 +0%,納斯達克指數 +0.5%, * S&P 500 +0.2%, * S&P 500 現在的交易區間在5,500至6,000,目前報價5,777 主要股市指數連續第三個交易日收高。這樣的價格走勢使得S&P 500指數突破其200日移動平均線(5,754)。

Jozef Kovach 09:21 2025-03-26 UTC+2

3月26日股市更新:S&P 500 及 NASDAQ 持續緩步復甦

在昨天的常規交易時段結束時,美國股市指數以正值收盤。S&P 500指數上漲0.16%,而納斯達克100指數上升了0.46%。

Jakub Novak 08:44 2025-03-26 UTC+2

美國股市重新獲得牛市動力。投資者捕捉到市場調整下行趨勢結束的信號

S&P500 3月25日市場更新 週一美國股市概況: 道瓊工業指數 +1.4%, 納斯達克綜合指數 +2.3%, S&P 500 +1.8%, S&P 500 交易於 5,767 點,範圍在 5,500 至 6,000 點之間 股市因對特朗普政府可能在即將施加的關稅上採取更為審慎的立場的樂觀情緒而復甦,這些關稅將於4月2日生效。 在此背景下,S&P 500指數上漲1.8%,收於兩週新高,超過200日移動平均線(5,752);同時,道瓊工業指數上漲1.4%,納斯達克綜合指數上漲2.3%。

Jozef Kovach 11:08 2025-03-25 UTC+2

股市面臨下跌威脅

昨日,S&P 500 指數上漲 1.76%,達到 5769 點的目標水準(1 月 13 日的低點)。同時,Marlin 振盪器的訊號線也觸及了上升趨勢區的邊界。

Laurie Bailey 04:59 2025-03-25 UTC+2

S&P 500:從狂熱到崩盤

在唐納·川普連任後,美國股市掀起的樂觀浪潮很快就消退了。在貿易衝突加劇的情況下,狂喜迅速讓位給了深度修正。

Anna Zotova 13:55 2025-03-24 UTC+2

3月24日美國股市:受到關稅消息影響,SP500和NASDAQ進一步走強

今天,由於有跡象顯示美國總統唐納·川普下一輪的關稅可能會比預期更為克制,美國和歐洲的股票期貨交易上升。投資者對美國和中國之間可能進行的談判報告作出了積極回應,這緩解了對貿易戰進一步升級的擔憂。

Jakub Novak 10:42 2025-03-24 UTC+2

美國市場試圖反彈。美國可能對伊朗進行打擊的前景支撐了油價

S&P 500 3月24日概況 美國市場試圖反彈 週五美國主要指數:道瓊:+0.1%,納斯達克:+0.5%,S&P 500:+0.1%,S&P 500:5,667,交易範圍:5,500–6,000。 在股市季度期權到期日,負面情緒占主導。

Jozef Kovach 10:15 2025-03-24 UTC+2

3月21日股票市場展望:S&P 500 和 NASDAQ 再次承壓

在昨日常規交易時段結束時,美國股指收盤時下跌。S&P 500指數下跌了0.22%,而Nasdaq 100指數則下跌了0.33%。

Jakub Novak 10:46 2025-03-21 UTC+2

美國市場處於整合階段。川普尋求參議院支持對伊朗進行打擊

S&P 500 3月21日總覽 週四,美國市場進入了一個整合階段,努力定義其下一步走向。 週四美國主要指數:道瓊工業指數:-0.1%,NASDAQ:-0.3%,S&P 500:-0.2%,S&P 500:5,662,交易區間:5,500-6,000。

Jozef Kovach 10:10 2025-03-21 UTC+2

聯邦儲備局向股市拋出救生圈

在#SPX的24小時圖中,波浪結構相當明晰。首先也是最重要的一點是,這個大規模的五浪結構非常寬廣,即便在最小尺度下也幾乎無法完整呈現在平台螢幕上。

Chin Zhao 09:21 2025-03-21 UTC+2
现在无法通话?
提出您的问题,用 在线帮助.
Widget callback
 

Dear visitor,

Your IP address shows that you are currently located in the USA. If you are a resident of the United States, you are prohibited from using the services of InstaFintech Group including online trading, online transfers, deposit/withdrawal of funds, etc.

If you think you are seeing this message by mistake and your location is not the US, kindly proceed to the website. Otherwise, you must leave the website in order to comply with government restrictions.

Why does your IP address show your location as the USA?

  • - you are using a VPN provided by a hosting company based in the United States;
  • - your IP does not have proper WHOIS records;
  • - an error occurred in the WHOIS geolocation database.

Please confirm whether you are a US resident or not by clicking the relevant button below. If you choose the wrong option, being a US resident, you will not be able to open an account with InstaForex anyway.

We are sorry for any inconvenience caused by this message.